Slovenia Onshore Wind Turbine Market (2026-2032) | Opportunities, Investment Trends, Value, Pricing Analysis, Competition, Strategy, Segmentation, Challenges, Share, Growth, Size, Revenue, Outlook, Supply, Strategic Insights, Demand, Competitive, Segments, Restraints, Forecast, Industry, Drivers, Trends, Companies, Consumer Insights, Analysis
Market Forecast By Component (Rotor Blade, Nacelle, Tower, Generator), By Capacity (Up to 1 MW, 1–3 MW, 3–5 MW, Above 5 MW), By Turbine Type (Horizontal Axis, Vertical Axis), By Application (Utility, Commercial, Off-Grid, Hybrid), By End Use (Industrial, Residential, Agricultural, Others) And Competitive Landscape
| Product Code: ETC10704612 | Publication Date: Apr 2025 | Updated Date: Feb 2026 | Product Type: Market Research Report | |
| Publisher: 6Wresearch | No. of Pages: 65 | No. of Figures: 34 | No. of Tables: 19 | |
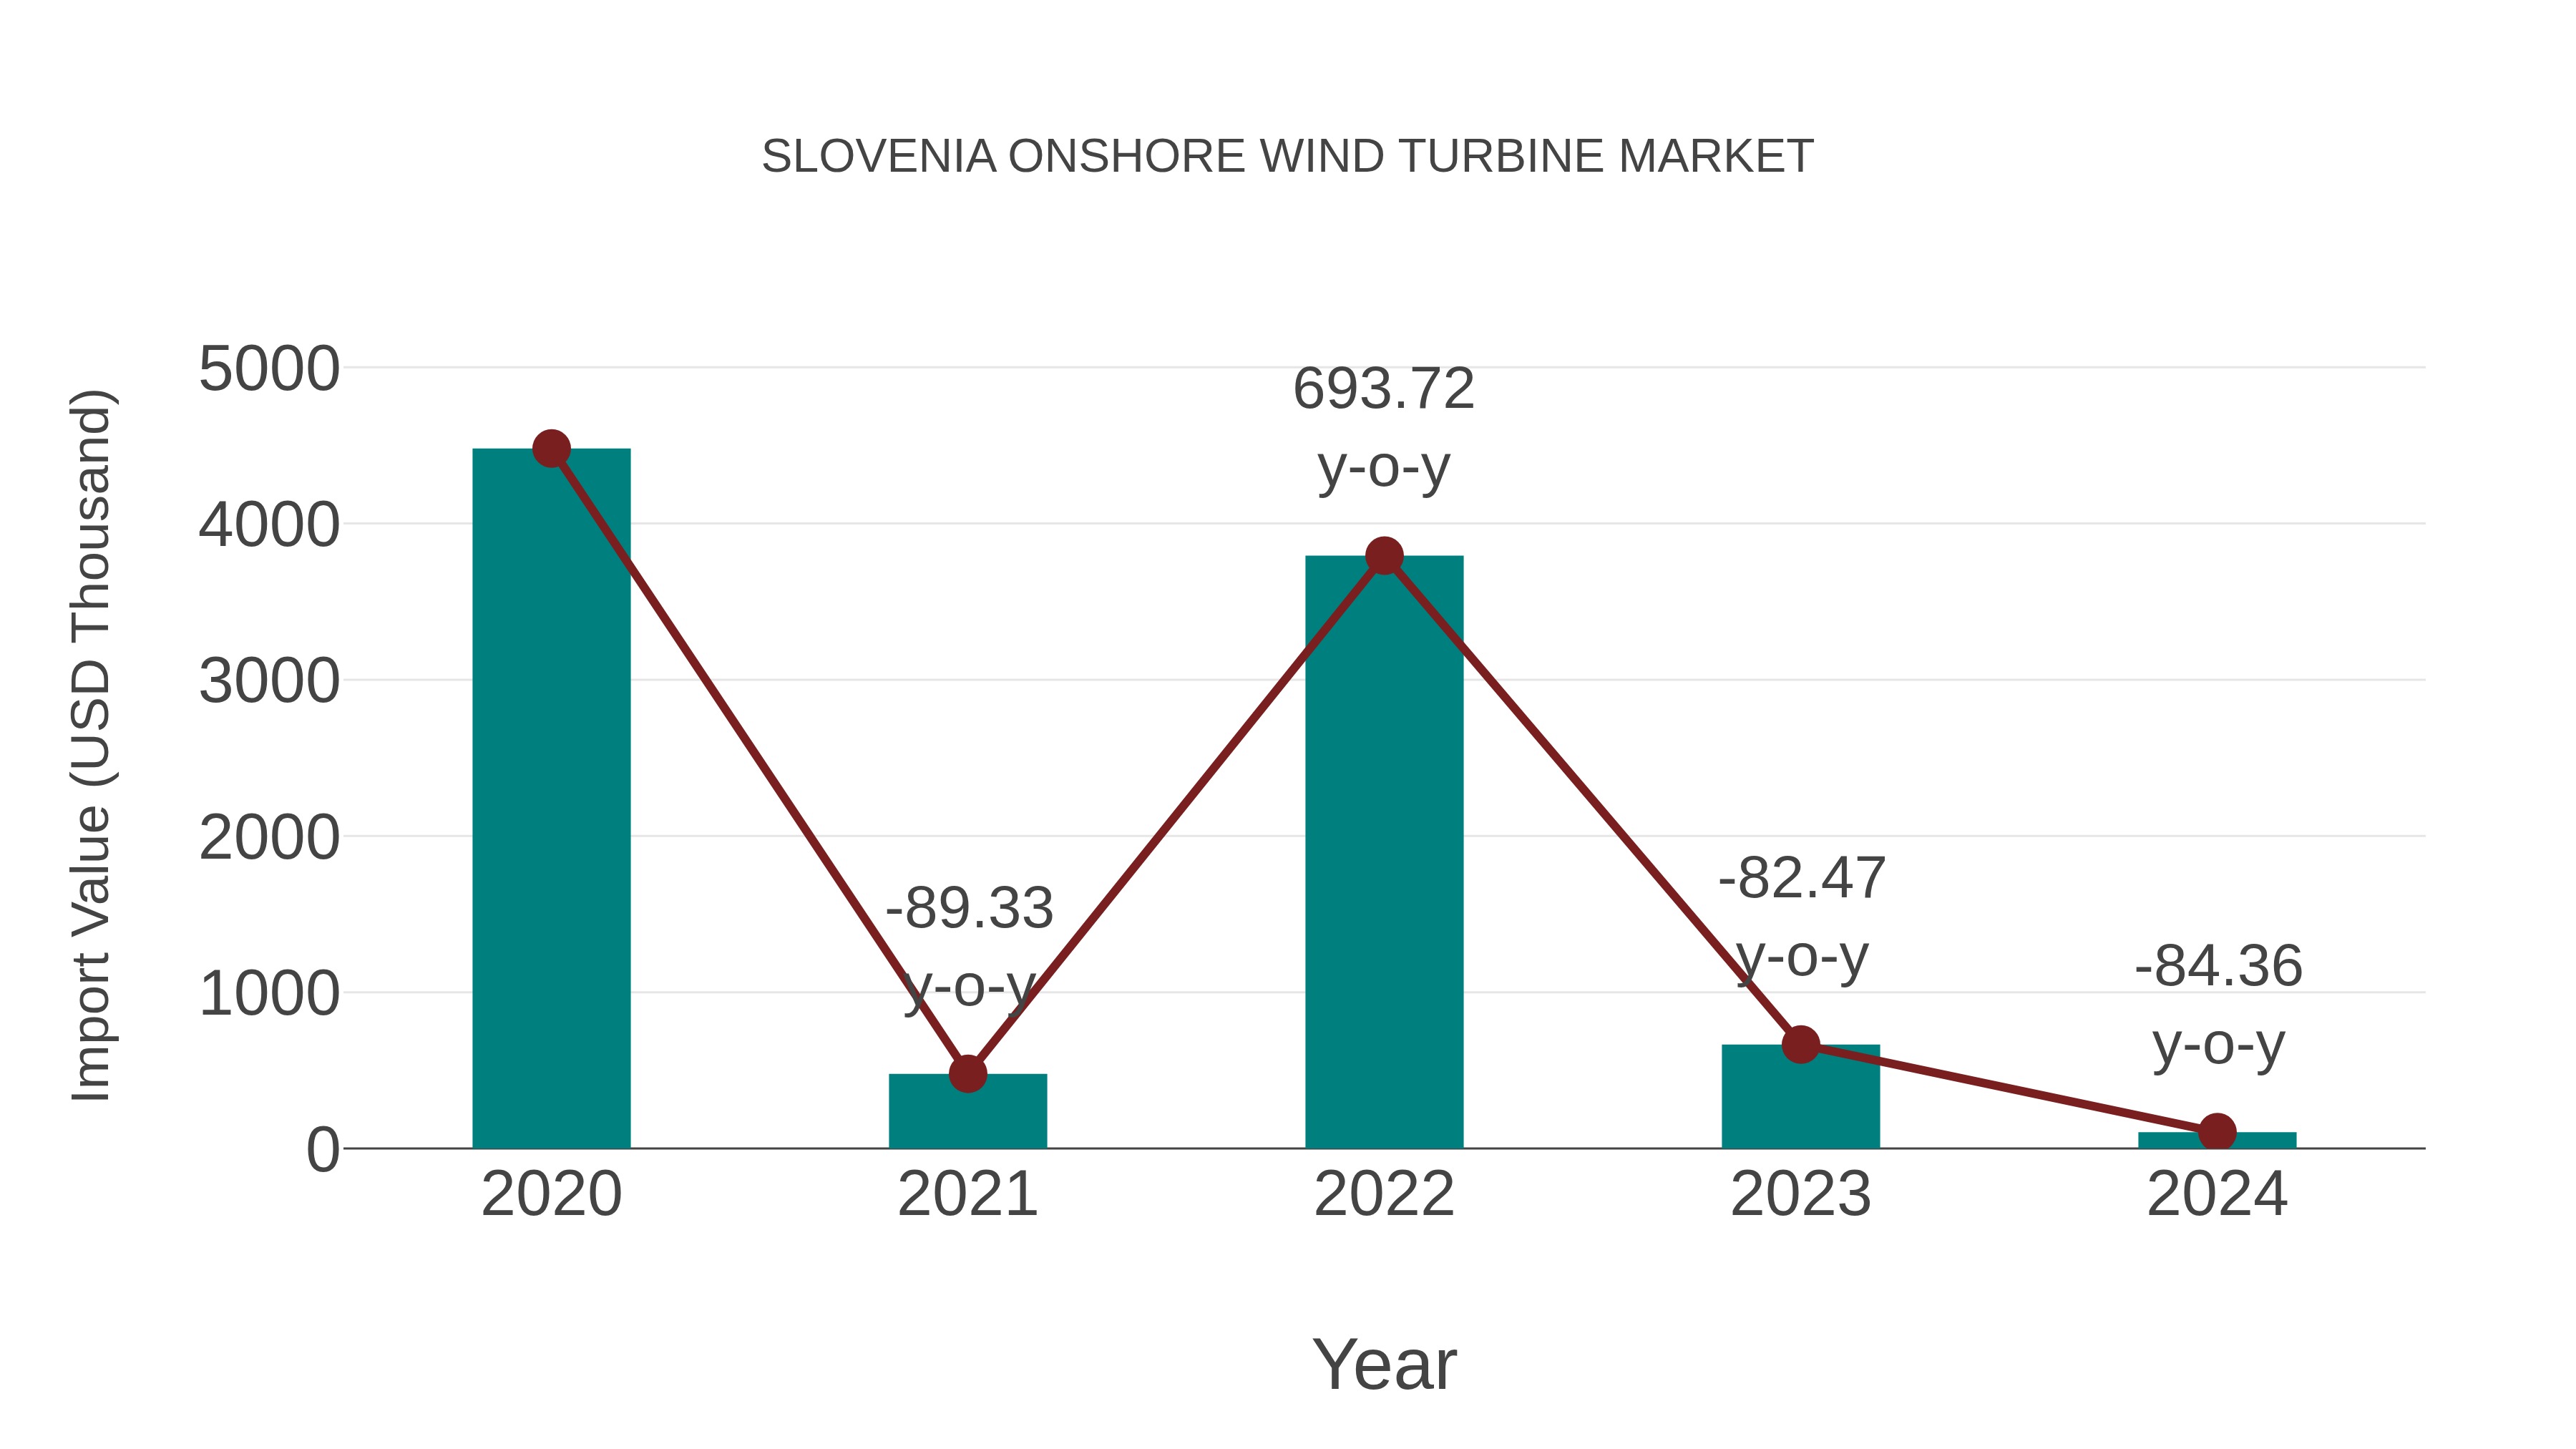
Slovenia Onshore Wind Turbine Market: Import Trend Analysis
Slovenia onshore wind turbine market experienced a notable decline in import momentum from 2023 to 2024, with a growth rate of -84.36%. The compound annual growth rate (CAGR) for imports in the period 2020-2024 stood at -60.97%. This sharp decrease could be attributed to shifting demand dynamics or regulatory changes impacting the market stability.
Key Highlights of the Report:
- Slovenia Onshore Wind Turbine Market Outlook
- Market Size of Slovenia Onshore Wind Turbine Market, 2025
- Forecast of Slovenia Onshore Wind Turbine Market, 2032
- Historical Data and Forecast of Slovenia Onshore Wind Turbine Revenues & Volume for the Period 2022-2032F
- Slovenia Onshore Wind Turbine Market Trend Evolution
- Slovenia Onshore Wind Turbine Market Drivers and Challenges
- Slovenia Onshore Wind Turbine Price Trends
- Slovenia Onshore Wind Turbine Porter's Five Forces
- Slovenia Onshore Wind Turbine Industry Life Cycle
- Historical Data and Forecast of Slovenia Onshore Wind Turbine Market Revenues & Volume By Component for the Period 2022-2032F
- Historical Data and Forecast of Slovenia Onshore Wind Turbine Market Revenues & Volume By Rotor Blade for the Period 2022-2032F
- Historical Data and Forecast of Slovenia Onshore Wind Turbine Market Revenues & Volume By Nacelle for the Period 2022-2032F
- Historical Data and Forecast of Slovenia Onshore Wind Turbine Market Revenues & Volume By Tower for the Period 2022-2032F
- Historical Data and Forecast of Slovenia Onshore Wind Turbine Market Revenues & Volume By Generator for the Period 2022-2032F
- Historical Data and Forecast of Slovenia Onshore Wind Turbine Market Revenues & Volume By Capacity for the Period 2022-2032F
- Historical Data and Forecast of Slovenia Onshore Wind Turbine Market Revenues & Volume By Up to 1 MW for the Period 2022-2032F
- Historical Data and Forecast of Slovenia Onshore Wind Turbine Market Revenues & Volume By 1 “3 MW for the Period 2022-2032F
- Historical Data and Forecast of Slovenia Onshore Wind Turbine Market Revenues & Volume By 3 “5 MW for the Period 2022-2032F
- Historical Data and Forecast of Slovenia Onshore Wind Turbine Market Revenues & Volume By Above 5 MW for the Period 2022-2032F
- Historical Data and Forecast of Slovenia Onshore Wind Turbine Market Revenues & Volume By Turbine Type for the Period 2022-2032F
- Historical Data and Forecast of Slovenia Onshore Wind Turbine Market Revenues & Volume By Horizontal Axis for the Period 2022-2032F
- Historical Data and Forecast of Slovenia Onshore Wind Turbine Market Revenues & Volume By Vertical Axis for the Period 2022-2032F
- Historical Data and Forecast of Slovenia Onshore Wind Turbine Market Revenues & Volume By Application for the Period 2022-2032F
- Historical Data and Forecast of Slovenia Onshore Wind Turbine Market Revenues & Volume By Utility for the Period 2022-2032F
- Historical Data and Forecast of Slovenia Onshore Wind Turbine Market Revenues & Volume By Commercial for the Period 2022-2032F
- Historical Data and Forecast of Slovenia Onshore Wind Turbine Market Revenues & Volume By Off-Grid for the Period 2022-2032F
- Historical Data and Forecast of Slovenia Onshore Wind Turbine Market Revenues & Volume By Hybrid for the Period 2022-2032F
- Historical Data and Forecast of Slovenia Onshore Wind Turbine Market Revenues & Volume By End Use for the Period 2022-2032F
- Historical Data and Forecast of Slovenia Onshore Wind Turbine Market Revenues & Volume By Industrial for the Period 2022-2032F
- Historical Data and Forecast of Slovenia Onshore Wind Turbine Market Revenues & Volume By Residential for the Period 2022-2032F
- Historical Data and Forecast of Slovenia Onshore Wind Turbine Market Revenues & Volume By Agricultural for the Period 2022-2032F
- Historical Data and Forecast of Slovenia Onshore Wind Turbine Market Revenues & Volume By Others for the Period 2022 - 2032F
- Slovenia Onshore Wind Turbine Import Export Trade Statistics
- Market Opportunity Assessment By Component
- Market Opportunity Assessment By Capacity
- Market Opportunity Assessment By Turbine Type
- Market Opportunity Assessment By Application
- Market Opportunity Assessment By End Use
- Slovenia Onshore Wind Turbine Top Companies Market Share
- Slovenia Onshore Wind Turbine Competitive Benchmarking By Technical and Operational Parameters
- Slovenia Onshore Wind Turbine Company Profiles
- Slovenia Onshore Wind Turbine Key Strategic Recommendations
Frequently Asked Questions About the Market Study (FAQs):
6Wresearch actively monitors the Slovenia Onshore Wind Turbine Market and publishes its comprehensive annual report, highlighting emerging trends, growth drivers, revenue analysis, and forecast outlook. Our insights help businesses to make data-backed strategic decisions with ongoing market dynamics. Our analysts track relevent industries related to the Slovenia Onshore Wind Turbine Market, allowing our clients with actionable intelligence and reliable forecasts tailored to emerging regional needs.
Yes, we provide customisation as per your requirements. To learn more, feel free to contact us on sales@6wresearch.com
1 Executive Summary |
2 Introduction |
2.1 Key Highlights of the Report |
2.2 Report Description |
2.3 Market Scope & Segmentation |
2.4 Research Methodology |
2.5 Assumptions |
3 Slovenia Onshore Wind Turbine Market Overview |
3.1 Slovenia Country Macro Economic Indicators |
3.2 Slovenia Onshore Wind Turbine Market Revenues & Volume, 2022 & 2032F |
3.3 Slovenia Onshore Wind Turbine Market - Industry Life Cycle |
3.4 Slovenia Onshore Wind Turbine Market - Porter's Five Forces |
3.5 Slovenia Onshore Wind Turbine Market Revenues & Volume Share, By Component, 2022 & 2032F |
3.6 Slovenia Onshore Wind Turbine Market Revenues & Volume Share, By Capacity, 2022 & 2032F |
3.7 Slovenia Onshore Wind Turbine Market Revenues & Volume Share, By Turbine Type, 2022 & 2032F |
3.8 Slovenia Onshore Wind Turbine Market Revenues & Volume Share, By Application, 2022 & 2032F |
3.9 Slovenia Onshore Wind Turbine Market Revenues & Volume Share, By End Use, 2022 & 2032F |
4 Slovenia Onshore Wind Turbine Market Dynamics |
4.1 Impact Analysis |
4.2 Market Drivers |
4.2.1 Increasing government support and favorable policies for renewable energy projects in Slovenia |
4.2.2 Rising awareness about the benefits of onshore wind energy in reducing carbon footprint |
4.2.3 Growing demand for sustainable energy sources to meet environmental targets |
4.3 Market Restraints |
4.3.1 High initial investment costs associated with setting up onshore wind turbine projects |
4.3.2 Limited suitable land availability for onshore wind turbine installations in Slovenia |
4.3.3 Challenges in obtaining necessary permits and approvals for onshore wind projects |
5 Slovenia Onshore Wind Turbine Market Trends |
6 Slovenia Onshore Wind Turbine Market, By Types |
6.1 Slovenia Onshore Wind Turbine Market, By Component |
6.1.1 Overview and Analysis |
6.1.2 Slovenia Onshore Wind Turbine Market Revenues & Volume, By Component, 2022 - 2032F |
6.1.3 Slovenia Onshore Wind Turbine Market Revenues & Volume, By Rotor Blade, 2022 - 2032F |
6.1.4 Slovenia Onshore Wind Turbine Market Revenues & Volume, By Nacelle, 2022 - 2032F |
6.1.5 Slovenia Onshore Wind Turbine Market Revenues & Volume, By Tower, 2022 - 2032F |
6.1.6 Slovenia Onshore Wind Turbine Market Revenues & Volume, By Generator, 2022 - 2032F |
6.1.7 Slovenia Onshore Wind Turbine Market Revenues & Volume, By Others, 2022 - 2032F |
6.2 Slovenia Onshore Wind Turbine Market, By Capacity |
6.2.1 Overview and Analysis |
6.2.2 Slovenia Onshore Wind Turbine Market Revenues & Volume, By Up to 1 MW, 2022 - 2032F |
6.2.3 Slovenia Onshore Wind Turbine Market Revenues & Volume, By 1“3 MW, 2022 - 2032F |
6.2.4 Slovenia Onshore Wind Turbine Market Revenues & Volume, By 3“5 MW, 2022 - 2032F |
6.2.5 Slovenia Onshore Wind Turbine Market Revenues & Volume, By Above 5 MW, 2022 - 2032F |
6.3 Slovenia Onshore Wind Turbine Market, By Turbine Type |
6.3.1 Overview and Analysis |
6.3.2 Slovenia Onshore Wind Turbine Market Revenues & Volume, By Horizontal Axis, 2022 - 2032F |
6.3.3 Slovenia Onshore Wind Turbine Market Revenues & Volume, By Vertical Axis, 2022 - 2032F |
6.4 Slovenia Onshore Wind Turbine Market, By Application |
6.4.1 Overview and Analysis |
6.4.2 Slovenia Onshore Wind Turbine Market Revenues & Volume, By Utility, 2022 - 2032F |
6.4.3 Slovenia Onshore Wind Turbine Market Revenues & Volume, By Commercial, 2022 - 2032F |
6.4.4 Slovenia Onshore Wind Turbine Market Revenues & Volume, By Off-Grid, 2022 - 2032F |
6.4.5 Slovenia Onshore Wind Turbine Market Revenues & Volume, By Hybrid, 2022 - 2032F |
6.5 Slovenia Onshore Wind Turbine Market, By End Use |
6.5.1 Overview and Analysis |
6.5.2 Slovenia Onshore Wind Turbine Market Revenues & Volume, By Industrial, 2022 - 2032F |
6.5.3 Slovenia Onshore Wind Turbine Market Revenues & Volume, By Residential, 2022 - 2032F |
6.5.4 Slovenia Onshore Wind Turbine Market Revenues & Volume, By Agricultural, 2022 - 2032F |
6.5.5 Slovenia Onshore Wind Turbine Market Revenues & Volume, By Others, 2022 - 2032F |
7 Slovenia Onshore Wind Turbine Market Import-Export Trade Statistics |
7.1 Slovenia Onshore Wind Turbine Market Export to Major Countries |
7.2 Slovenia Onshore Wind Turbine Market Imports from Major Countries |
8 Slovenia Onshore Wind Turbine Market Key Performance Indicators |
8.1 Average capacity factor of onshore wind turbines in Slovenia |
8.2 Number of new onshore wind projects announced or initiated |
8.3 Investment in research and development for improving onshore wind turbine technology |
9 Slovenia Onshore Wind Turbine Market - Opportunity Assessment |
9.1 Slovenia Onshore Wind Turbine Market Opportunity Assessment, By Component, 2022 & 2032F |
9.2 Slovenia Onshore Wind Turbine Market Opportunity Assessment, By Capacity, 2022 & 2032F |
9.3 Slovenia Onshore Wind Turbine Market Opportunity Assessment, By Turbine Type, 2022 & 2032F |
9.4 Slovenia Onshore Wind Turbine Market Opportunity Assessment, By Application, 2022 & 2032F |
9.5 Slovenia Onshore Wind Turbine Market Opportunity Assessment, By End Use, 2022 & 2032F |
10 Slovenia Onshore Wind Turbine Market - Competitive Landscape |
10.1 Slovenia Onshore Wind Turbine Market Revenue Share, By Companies, 2025 |
10.2 Slovenia Onshore Wind Turbine Market Competitive Benchmarking, By Operating and Technical Parameters |
11 Company Profiles |
12 Recommendations |
13 Disclaimer |
Export potential assessment - trade Analytics for 2030
Export potential enables firms to identify high-growth global markets with greater confidence by combining advanced trade intelligence with a structured quantitative methodology. The framework analyzes emerging demand trends and country-level import patterns while integrating macroeconomic and trade datasets such as GDP and population forecasts, bilateral import–export flows, tariff structures, elasticity differentials between developed and developing economies, geographic distance, and import demand projections. Using weighted trade values from 2020–2024 as the base period to project country-to-country export potential for 2030, these inputs are operationalized through calculated drivers such as gravity model parameters, tariff impact factors, and projected GDP per-capita growth. Through an analysis of hidden potentials, demand hotspots, and market conditions that are most favorable to success, this method enables firms to focus on target countries, maximize returns, and global expansion with data, backed by accuracy.
By factoring in the projected importer demand gap that is currently unmet and could be potential opportunity, it identifies the potential for the Exporter (Country) among 190 countries, against the general trade analysis, which identifies the biggest importer or exporter.
To discover high-growth global markets and optimize your business strategy:
Click Here
Pricing
- Single User License$ 1,995
- Department License$ 2,400
- Site License$ 3,120
- Global License$ 3,795

Search
Thought Leadership and Analyst Meet


Our Clients
Related Reports
- test raman
- Canada Oil and Gas Market (2026-2032) | Share, Segmentation, Value, Industry, Trends, Forecast, Analysis, Size & Revenue, Growth, Competitive Landscape, Outlook, Companies
- Germany Breakfast Food Market (2026-2032) | Industry, Share, Growth, Size, Companies, Value, Analysis, Revenue, Trends, Forecast & Outlook
- Swaziland Nano Battery Market (2026-2032) | Industry, Value, Analysis, Supply, Consumer Insights, Investment Trends, Segmentation, Challenges, Pricing Analysis, Size, Opportunities, Share, Growth, Demand, Companies, Competition, Segments, Strategy, Strategic Insights, Outlook, Trends, Revenue, Competitive, Forecast, Restraints, Drivers
- Slovenia Nano Battery Market (2026-2032) | Revenue, Competition, Demand, Investment Trends, Opportunities, Strategic Insights, Pricing Analysis, Companies, Growth, Forecast, Restraints, Analysis, Consumer Insights, Size, Segments, Challenges, Strategy, Drivers, Competitive, Supply, Segmentation, Share, Outlook, Value, Trends, Industry
- Papua New Guinea Nano Battery Market (2026-2032) | Investment Trends, Outlook, Consumer Insights, Share, Industry, Growth, Restraints, Strategy, Revenue, Drivers, Segments, Strategic Insights, Opportunities, Forecast, Analysis, Segmentation, Competitive, Value, Supply, Competition, Size, Trends, Demand, Companies, Pricing Analysis, Challenges
- Madagascar Nano Battery Market (2026-2032) | Restraints, Forecast, Segments, Share, Size, Growth, Demand, Strategic Insights, Opportunities, Value, Strategy, Industry, Competitive, Consumer Insights, Analysis, Supply, Pricing Analysis, Trends, Drivers, Competition, Segmentation, Outlook, Revenue, Investment Trends, Companies, Challenges
- Luxembourg Nano Battery Market (2026-2032) | Consumer Insights, Outlook, Demand, Revenue, Size, Growth, Supply, Forecast, Opportunities, Strategic Insights, Strategy, Drivers, Trends, Companies, Investment Trends, Competition, Segmentation, Challenges, Restraints, Value, Share, Pricing Analysis, Competitive, Industry, Segments, Analysis
- Iceland Nano Battery Market (2026-2032) | Strategic Insights, Challenges, Opportunities, Share, Supply, Companies, Strategy, Size, Pricing Analysis, Forecast, Restraints, Competition, Growth, Trends, Revenue, Segmentation, Value, Demand, Drivers, Consumer Insights, Segments, Outlook, Competitive, Investment Trends, Industry, Analysis
- Honduras Nano Battery Market (2026-2032) | Consumer Insights, Trends, Share, Forecast, Outlook, Segments, Segmentation, Challenges, Analysis, Strategic Insights, Supply, Pricing Analysis, Demand, Industry, Companies, Growth, Competitive, Restraints, Strategy, Drivers, Competition, Investment Trends, Revenue, Size, Value, Opportunities
Industry Events and Analyst Meet
2nd CYBER FIRST QATAR EDITION

Truck Trailer and Tyre Expo 2025

Dairy, Food and Bakery Expo 2025

Dairy and Food Expo 2025

India Green Energy Expo
Whitepaper
- Middle East & Africa Commercial Security Market Click here to view more.
- Middle East & Africa Fire Safety Systems & Equipment Market Click here to view more.
- GCC Drone Market Click here to view more.
- Middle East Lighting Fixture Market Click here to view more.
- GCC Physical & Perimeter Security Market Click here to view more.
6WResearch In News
- Doha a strategic location for EV manufacturing hub: IPA Qatar
- Demand for luxury TVs surging in the GCC, says Samsung
- Empowering Growth: The Thriving Journey of Bangladesh’s Cable Industry
- Demand for luxury TVs surging in the GCC, says Samsung
- Video call with a traditional healer? Once unthinkable, it’s now common in South Africa
- Intelligent Buildings To Smooth GCC’s Path To Net Zero